
Hemisphere Temperature Disparity: #TidyTuesday 2023, Week 28
- toldham2
- Jul 18, 2023
- 3 min read
Using R/Tidyverse to analyze potential inequality in global climate phenomenon.


Climate change has been a topic of intense study and debate for decades, with the consequences of human activities on global temperature becoming increasingly clear. For this week's #TidyTuesday challenge, I delved into the data to analyze how temperature deviation has shifted over time across our planet's hemispheres, leading to some interesting and alarming findings.
For those not familiar, the #TidyTuesday challenge is a weekly social data project where the R programming community creates and shares data visualizations using the 'tidyverse' set of packages.
Hemisphere Temperature Deviation Difference Over Time
Starting with a bar chart of Hemisphere Temperature Deviation Difference Over Time, we can clearly see the escalating disparity between the hemispheres. The chart indicates that the recent climate shift has made the northern hemisphere significantly warmer than in the past. This raises a critical question: what could be causing this escalating temperature deviation?
One possible natural contributor is the Atlantic Multidecadal Oscillation (AMO). This phenomenon, in its positive phase, leads to warmer sea surface temperatures in the North Atlantic, influencing atmospheric conditions and causing warmer temperatures over the nearby land in the Northern Hemisphere.
However, anthropogenic activities - primarily increasing greenhouse gas concentrations due to human practices such as burning fossil fuels and deforestation - could be exacerbating this trend. The man-made climate change could be amplifying the warming effect of the AMO's positive phase, leading to the observed intensification of conditions in the Northern Hemisphere.
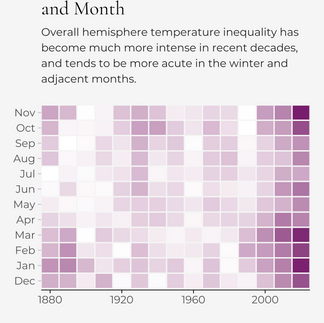
Absolute Hemisphere Temperature Deviation Difference by Decade and Month
Next, a heat map of Absolute Hemisphere Temperature Deviation Difference by Decade and Month provides further insight into this warming trend. The most intense differences are not evenly distributed throughout the year but are rather concentrated in the winter months.
This information indicates that while the overall hemisphere temperature inequality has been more intense in recent decades, this deviation is particularly pronounced during the colder part of the year. This might imply a disruption in the natural balance of Earth's climate, causing increased temperature variation during these periods.

Temperature Deviation by Latitude Band
Finally, a map of the Temperature Deviation by Latitude Band paints an even clearer picture of this issue. The data shows the northern hemisphere as consistently warmer, especially around the North Pole.
This illustrates that the warming is not uniform across the planet but is more prominent in the northern latitudes. This trend could have numerous implications for those areas, including altered weather patterns, disruption to ecosystems, and increased melting of ice caps, contributing to global sea level rise.
Conclusions
The data examined in this week's #TidyTuesday challenge reveal a disconcerting trend in global temperatures. The northern hemisphere is experiencing increasingly warmer temperatures than its southern counterpart, particularly in recent decades and during the winter months.
The shift is most pronounced in the northern latitudes, which could lead to significant environmental and climatic changes if this trend continues. It emphasizes the urgency of climate action - understanding these changes and their implications is the first step towards devising effective strategies to mitigate the impacts of global warming.
Data exploration and visualization, such as through projects like #TidyTuesday, are an essential part of this process. It allows us to distill complex information into tangible insights and provide a clear view of the state of our planet, which can then be used to inform policy and conservation efforts.
Please note, the code and data used in this analysis are available on my GitHub page for further exploration and study. I encourage anyone interested in data science or climate change to examine the data for themselves. We can all contribute to understanding and addressing this global challenge.


Comments